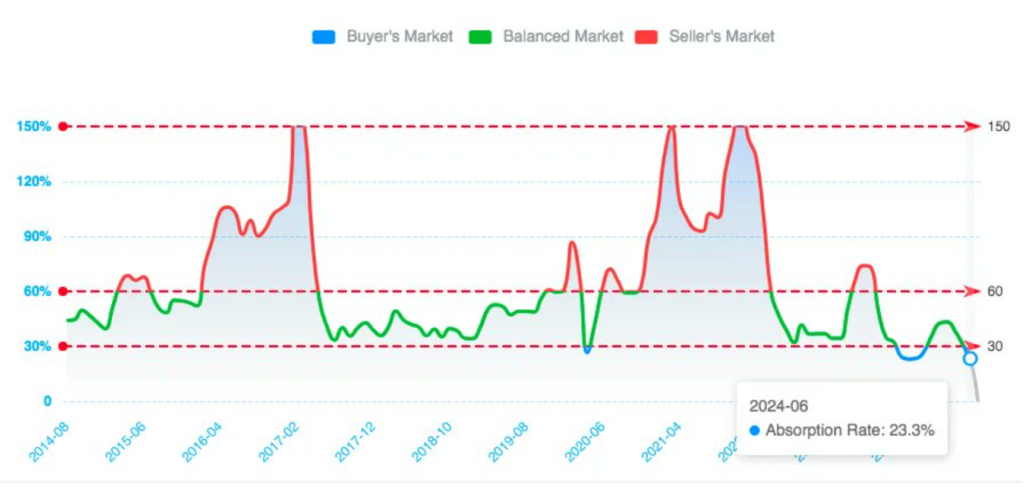
This graph depicts the absorption rate in the GTA real estate market from August 2014 to June 2024.

Absorption Rate Categories:
- Blue (Buyer’s Market): Rates below 30%.
- Green (Balanced Market): Rates between 30% and 60%.
- Red (Seller’s Market): Rates above 60%.
Historical Trends vs current stats:
Significant peaks in early 2017 and early 2022 indicate strong seller’s markets during those periods. However, now trend has change to buyer favor as the absorption rate is 23.3%, indicating a buyer’s market.
Investor’s nightmares
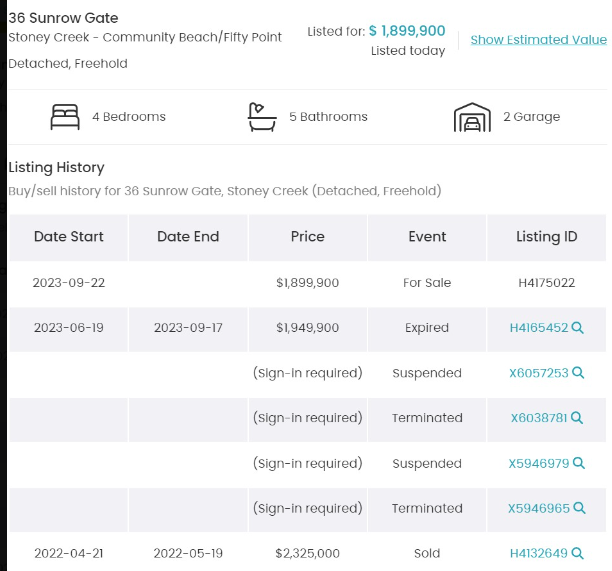
Example -1
The investor bought a house in 2022 for $2.35 million and attempted to rent it for $7,000 a month. After multiple price cuts, re-listings, and offer nights, the B-Lender couldn’t sell it. They’re now attempting a $400k price cut.

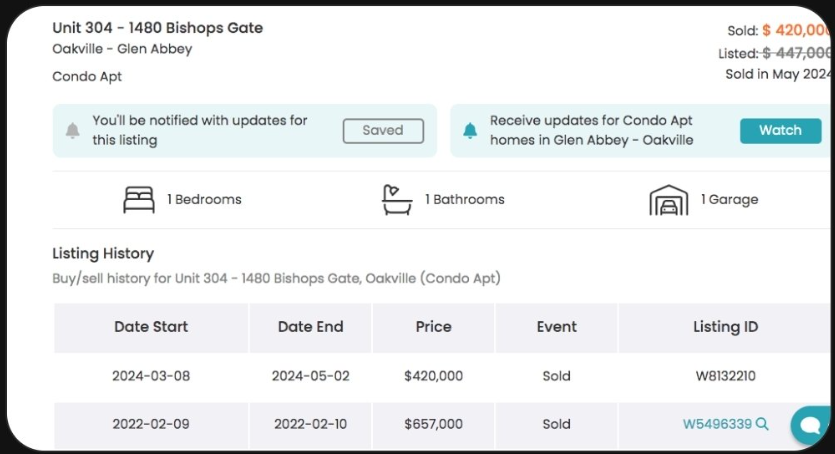
Example –2
In 2022, a condo located at 1480 Bishops Gate in Oakville was purchased for the price of $657,000. When we fast forward to May 2024, we see that the identical house was resold for $420,000, which represents a startling loss of $237,000, which is equivalent to a decline of 36.1%.


