Short Trade: Palo Alto Networks (PANW) – 232.64
Trade Details:
- High volume selling with BIG red candles.
- RSI is in the Oversold zone but the stock is showing bearish price actions.
- In case of a Gap up or Gap Down opening, Do not enter into the trade this may be risky according to our Risk reward.
- Risk-Reward Ratio = more than 1:3
- Enter after crossing the entry price after opening the flat.
- Enter again in the trade if it crosses the entry price in a downtrend.
- closes below 200 EMA.
Trade, SL, and Target –

Entry = BELOW 231.70
Stop Loss = 235.70
Target = 220 & 215
Please note: Please make sure if it may go against our direction, you have to enter again if it crosses our entry price because it may give a big move. so, don’t miss the big move and be ready to give small stop losses. Please Trade with less quantity according to your capacity.
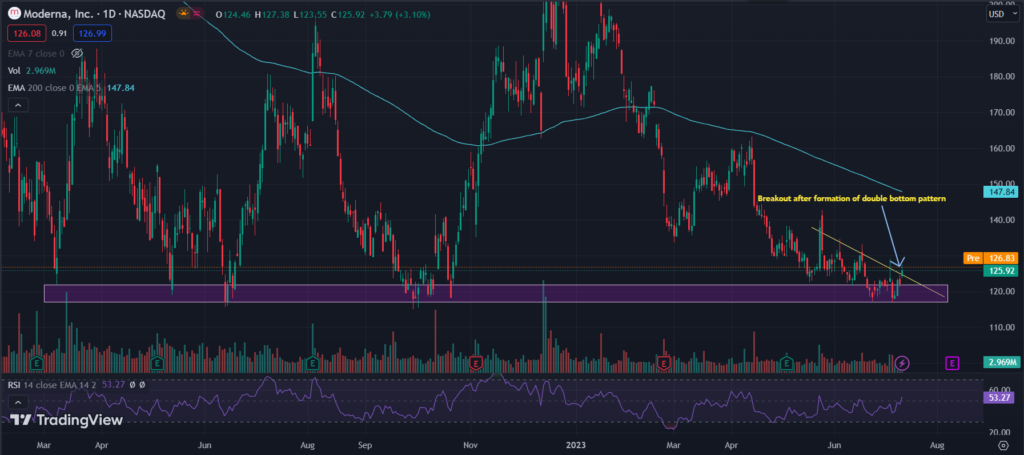
Long Trade: MODERNA. (MRNA) – 125.92
Trade Details:
- Formation of double bottom pattern
- RSI is above 53, and it is in an uptrend
- It is reversing from a lower support zone which attracts more buyers
- Risk-Reward = more than 1:3, it may touch a higher level but don’t forget to trail your stop loss accordingly.
- You have to follow strict stop loss because at the current market price, the breakout may fail because of trendline resistance.

Trade SL and Target –
Entry = 126.50
Stop Loss = 124.90
Target = 128.50 & 133
Please note: Don’t trade in case of a Gap up or Gap down opening. Trade will be executed only if it opens flat and breaks the price in an upside direction. You can hold this trade for 2 or 3 days but only if it goes in our favour and strictly follow stoploss because if it goes against then it may fall sharply because it is trading at make or break level also.
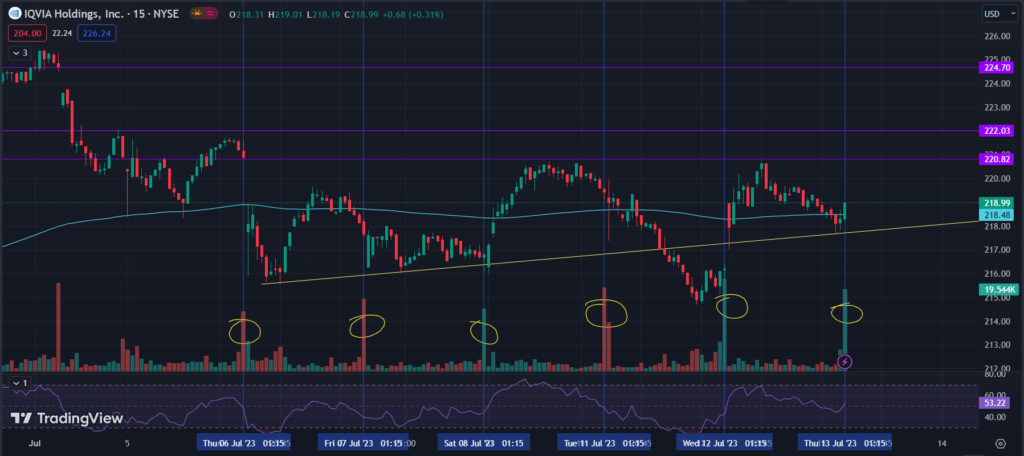
Long Trade: IQVIA HOLDINGS (IQV) – 219.01
Trade Details:
- Notice the blue vertical line in the chart, on that days there are high volumes and from the next day stocks react accordingly.
- Horizontal purple lines are resistance levels and stock may pause on these levels. These lines are also considered our target prices.
- Trail your stop loss at cost after getting a 1:1 target and wait for 222 and 224.70 levels.
- Risk-Reward = 1:2 +
- RSI is also in an uptrend, above 53
- It also follows the trendline support.

Trade SL and Target –
Entry = Above 219
Stop Loss = 217.48
Target = 220.80 & 222 & 224.70
Please note: Trail your stoploss at cost price after getting 1:1 risk reward target. This is high probability trade so you can trade with your full quantity with strict stoploss. You can also hold this trade for next day.
To get regular updates on stocks, please join our Discord community.
Our Articles on Long-Term Stock Analysis
My best read on trading is this Book

