

Long Trade: Leidos Holdings, Inc. (LDOS) – 97.56
Bullish Stocks Long Trade
Trade Details:
- Breakout from the trendline above 97.52
- It may retest the upper resistance of 100 which is also a psychological level.
- If it starts sustaining above the 97 levels then it may go to the higher.
- RSI is also at a good level of 52.74
- Trail your stop loss at entry price after getting 1:1 Risk Reward
- Risk Reward 1:2+
Trade, SL, and Target –

Entry = Above 98
Stop Loss = 96.91
Target = 100
Please note: It may show volatility in the first few minutes of markets. You must try to enter in a trade after 10 minutes of market oepning.
Bullish Trade: Mondelez International, Inc. (MDLZ) – 73.81
Trade Details:
- It is trading in a channel and is currently at a lower level of the channel.
- Last day closing is above the 200 EMA.
- The target level is the upper trendline of this channel.
- RSI is in the mid zone and it may go to 70 levels if it crosses 45 and 50 levels.
- Trail your stop loss to the entry price after getting 1:1 Risk Reward.
- Risk Reward = 1:3
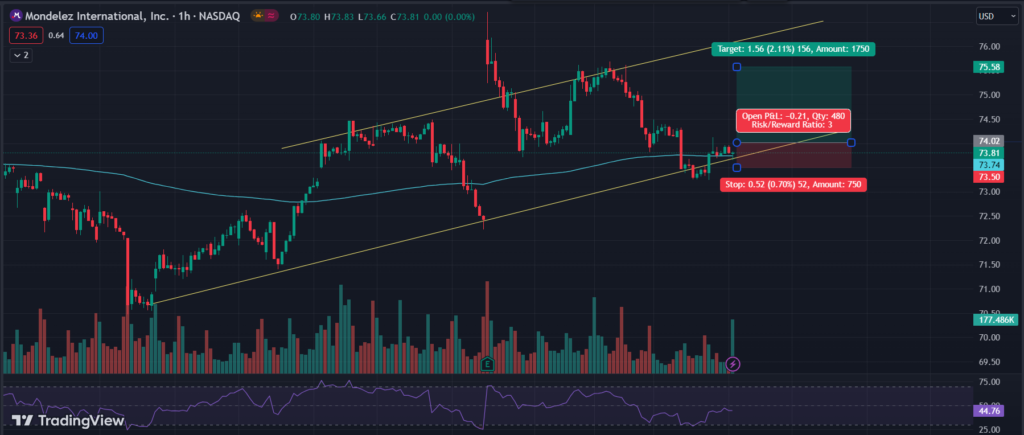
Trade SL and Target –
Entry = Above 74
Stop Loss = 73.50
Target = 75.50
Please note: Don’t trade this stock until it is trading below the lower trendline.
Short Trade: FactSet Research Systems Inc. (FDS) – 421.98
- Strong resistance at the current level (Horizontal lines)
- we can also draw a trendline up the upper levels which acts as a resistance.
- if this goes below 200 EMA (421) then it may fall sharply.
- RSI is turning downward into a bearish below 45 levels.
- Support of 415 on the lower side may be re-tested.
- Risk Reward = 1:2

Trade SL and Target –
Entry = Below 421.25
Stop Loss = 424.11
Target = 415.60
Please note: Ignore this stock if it starts trading above the horizontal line because it is a resistance. It may become bullish avobe the line.
To get regular updates on stocks, please join our Discord community.
Our Articles on Long-Term Stock Analysis
My best read on trading is this Book