GBPUSD Analysis:- GBPUSD Technical Analysis Today 2025
The GBPUSD technical analysis today 2025 reveals a bullish setup driven by key support levels and strong technical indicators. Let’s dive into the analysis across multiple time frames to understand potential opportunities for traders.

1. Weekly Time Frame Analysis
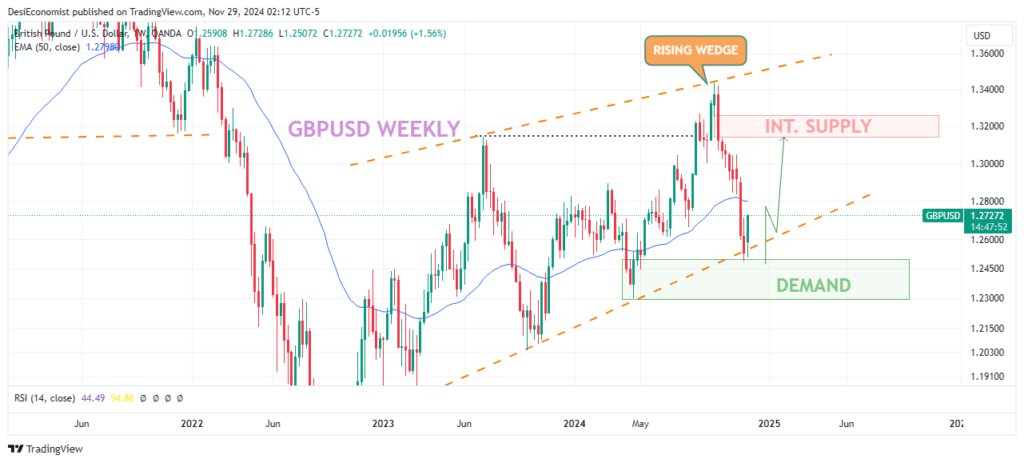
On the weekly chart, GBPUSD is trading within a bullish rising wedge pattern, suggesting continued upward movement. The previous weekly candle tested an internal swing low from April 2024 around the 1.2500 price level, which acts as a strong demand zone.
Key observations:
- Rising Wedge Support: The price is respecting the lower trendline of the wedge, reinforcing bullish momentum.
- Ultra-High Volume: The weekly chart shows ultra-high volume near the 1.2500 level, which is a bullish indication of buyer interest at this price zone.
- Expected Bounce: We expect GBPUSD to bounce toward the upside from the 1.2500 level in the coming weeks.
These factors position GBPUSD as an asset to watch in the context of GBPUSD technical analysis today 2025.

2. Daily Time Frame Analysis
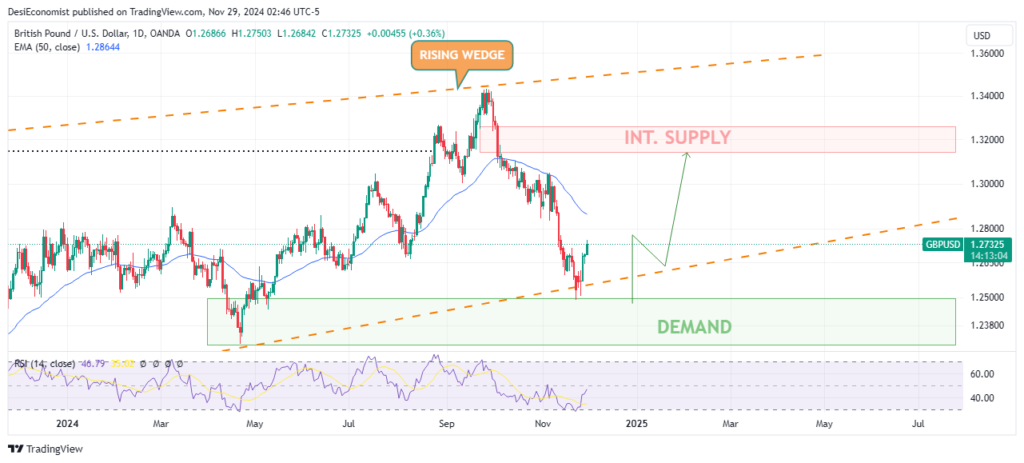
On the daily chart, GBPUSD has tested the RSI 30 level, indicating the pair is in oversold territory. This supports a potential reversal and upward move in the near term.
Two unmitigated supply zones have been identified above the current price:
- 1.3000
- 1.3230
The daily setup suggests GBPUSD is poised for a bullish recovery, targeting these supply zones in the coming days.
Key Levels for GBPUSD
- Buy Entry Range: 1.2500 – 1.2630
- Stop Loss (SL): 1.2388
- Target (TGT): 1.3200
CHECKOUT HERE :- Next Good Swing Trade With Target & Stop Loss
3. Why GBPUSD Shows a Bullish Setup
- Demand Zone Support: The 1.2500 level has proven to be a strong demand zone, supporting potential upside.
- Rising Wedge Pattern: GBPUSD is trading within a rising wedge, which often signals continued bullish momentum.
- Oversold RSI: The RSI on the daily chart is in oversold territory, suggesting a potential reversal.
- Ultra-High Volume: The high volume near the demand zone confirms buyer interest and supports bullish continuation.
- Supply Zone Targets: The unmitigated supply zones at 1.3000 and 1.3230 provide realistic upside targets for GBPUSD.
Strategy for GBPUSD
For traders analyzing GBPUSD technical analysis today 2025, the following strategy is recommended:
- Look for buy opportunities within the 1.2500 – 1.2630 range.
- Set a stop loss at 1.2388 to manage risk.
- Target the 1.3200 level, aligning with the upper supply zone.
4. Invalidation of the Bullish Setup
If the price breaks and closes below 1.2346, the current bullish setup will be invalid, signaling further downside risk.
Conclusion: GBPUSD Poised for Bullish Continuation
In the context of GBPUSD technical analysis today 2025, the pair is positioned for a bullish recovery. With strong demand zone support at 1.2500, a rising wedge pattern, and oversold RSI levels, GBPUSD is likely to target the 1.3000 and 1.3230 supply zones in the near term.
Traders should monitor the 1.2500 – 1.2630 range for buy opportunities while managing risk with a stop-loss at 1.2388. Any break below 1.2346 would invalidate the bullish setup.
FAQs
1. What is the current trend for GBPUSD?
GBPUSD is trading in a bullish trend within a rising wedge pattern.
2. What is the key demand zone for GBPUSD?
The key demand zone for GBPUSD is around the 1.2500 price level.
3. Where are the supply zones for GBPUSD?
Key supply zones are located at 1.3000 and 1.3230.
Read More Information About US Stock Market
Note: Always remember: risk no more than 1% per trade.” Keep trailing your stop loss to secure bigger profits.
Please note this is only an opinion and not financial advice.
To get regular updates on stocks, please join Free our Discord community , Join Our Whatsapp Group
Our Articles on Long-Term Stock Analysis My best read on trading is this Book All Swing Trades Idea’s Here

