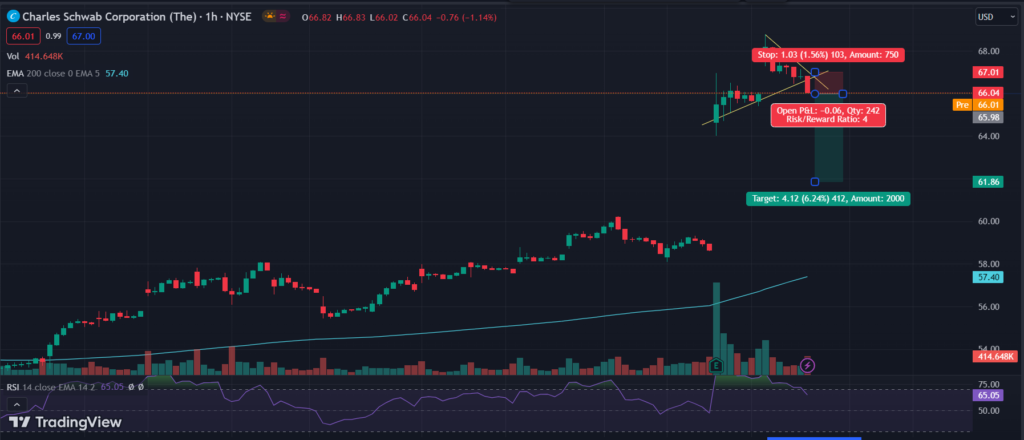
Sell Trade: The Charles Schwab Corporation (SCHW) – 66.04
Trade Details:
- Symmetrical Triangle Breakdown.
- It will try to fill the gap between 60 and 64.
- 200 EMA will act as a support level and EMA will also shift upwards.
- Rsi is in a downtrend at 65.05
- You can Trail your stop loss at entry price after getting 1:1 risk reward.
- Risk Reward 1:4
- You can also hold this trade for 60 but with a trailing stop loss.
Trade, SL, and Target –

Entry = Below 66
Stop Loss = 67.05
Target = 64 / 62.10 / 60.25
Please note: Don’t trade in case of Gap up opening and if the market sentiment is positive. You can hold this trade but with a strict stop loss. This stock may try to fill the GAP between 64 and 60.
Long Trade: The Hershey Company (HSY) – 100.92
Trade Details:
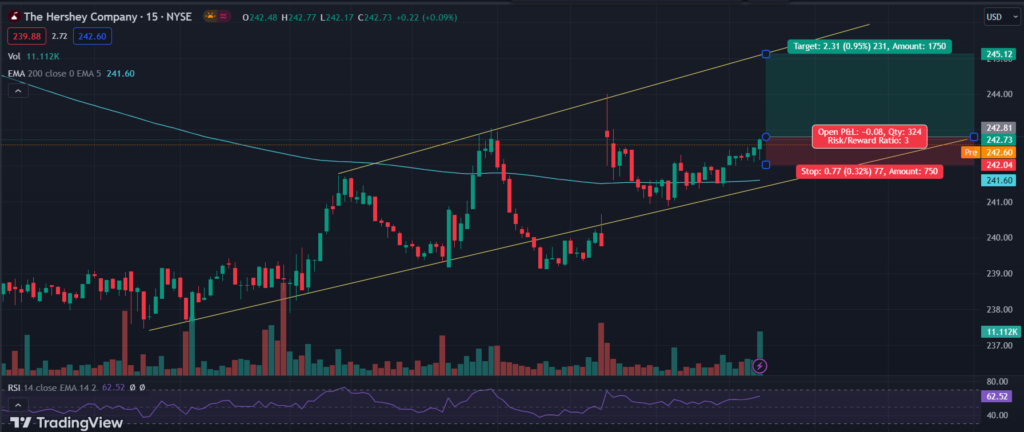
- Stock is trading in a channel or in a range-bound area.
- It can touch the upper trendline which is resistance.
- RSI is in the uptrend zone and it may touch the upper 75 to 80 levels.
- Trail your stop loss to the entry price after getting a 1:1 risk reward.
- Risk Reward = 1:3

Trade SL and Target –
Entry = Above 242.80
Stop Loss = 242
Target = 245
Please note: Ignore this trade if it opens below the trendline or 241.50 levels. trade only if it opens flat and then it gives a breakout. You can re-enter again if overall market trend is in our favor and stock retest entry level after hitting stop loss on the first time.
Short Trade: Tesla, Inc. (TSLA) – 291.26
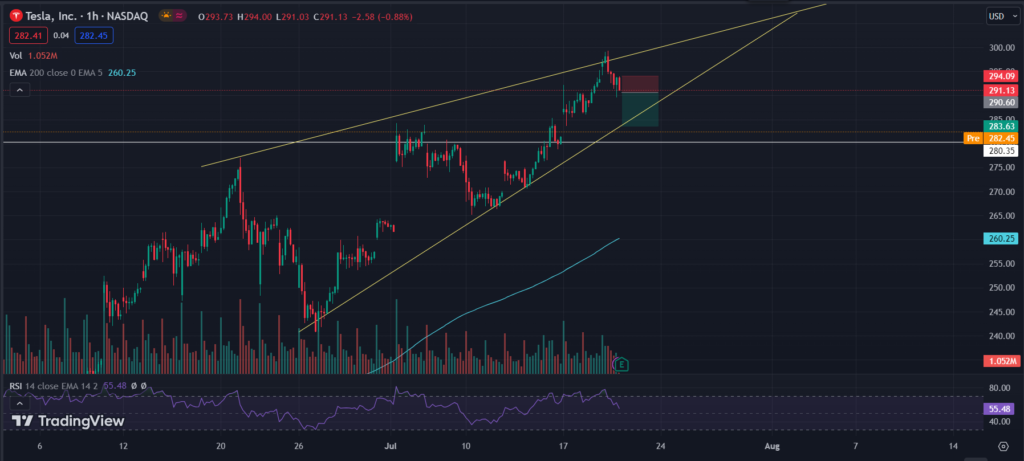
- This stock will try to touch the lower trendline support around 285 levels
- Tesla is in a very strong uptrend and it may reverse after touching the lower trendline support.
- It may come down to near 280 levels which are high support zone because the stock reversed from that level in previous trading sessions. (white horizontal lines).
- RSI is in the downtrend and it may touch the 40 level.
- This stock is in an uptrend, you have to follow a strict stop loss at 294.10 and don’t hold this trade if market sentiment is against this stock.

Trade SL and Target –
Entry = 290.60
Stop Loss = 294.10
Target = 283.65 & 280.50
Please note: This is contra-trade, we trade against the trend of this stock. You have to trade with less quantity for proper risk and money management.
To get regular updates on stocks, please join our Discord community.
Our Articles on Long-Term Stock Analysis
My best read on trading is this Book

