

Bullish Trade: Comcast Corporation (CMCSA) – 45.26
Top
Trade Details:
- It is reversing from the support level of 45, Creating a symmetrical triangle pattern that may lead to a breakout in this stock.
- Trade only when it crosses the high of the last swing and sustains above 45.32 levels.
- Wait for the positive price action formation.
- RSI is ready to run from 43 levels.
- Trail your stop loss at entry price after getting a 1:1 risk reward.
- Risk Reward 1:4
- When you are entering into this trade look at the overall market trend. If the market trend is negative then ignore this trade.
Trade, SL, and Target –

Entry = Above 45.32
Stop Loss = 45.10
Target = 46.20
Please note: If this stock resist around 45.60 levels than you can exit and enter again after trendline breakout. You can hold this trade for next trading session if it breakout the trendline today.
Buy Trade: Broadridge Financial Solutions, Inc. (BR) – 167.88
Trade Details:
- Break the high of the last 5-6 candles with bullishness.
- You can keep your stop loss below the last 5-6 candles swing.
- RSI is very bullish and reverse from oversold zone.
- Trail your stop loss to the entry price after getting a 1:1 risk reward.
- Risk Reward = 1:3
- Very good support at current levels, where previous resistance acts as a new support levels.

Trade SL and Target –
Entry = Above 168
Stop Loss = 167.38
Target = 169.83
Please note: Enter above 200 EMA or 168 levels and ignore this trade in case of Gap down opening. Trail your SL to cost after 1:1 R:R.
Long Trade: W. R. Berkley Corporation (WRB) – 168.21
- This stock is now trading at the support zone of 200 EMA.
- As it breaks the rectangular zone it may shoot up to 62.50 levels
- A strong Bullish Hammer candle, showing buyers interest at this level.
- This stock is reversing from the downtrend and changing its pattern into a bullish trend in the short term.
- RSI is looking bullish because it is reversing from the bottom support zone.
- Strictly follow the Stoploss and Target and trail your stop loss around cost after getting a 1:1 risk reward on your trade.
- Risk Reward = 1:2.5 +
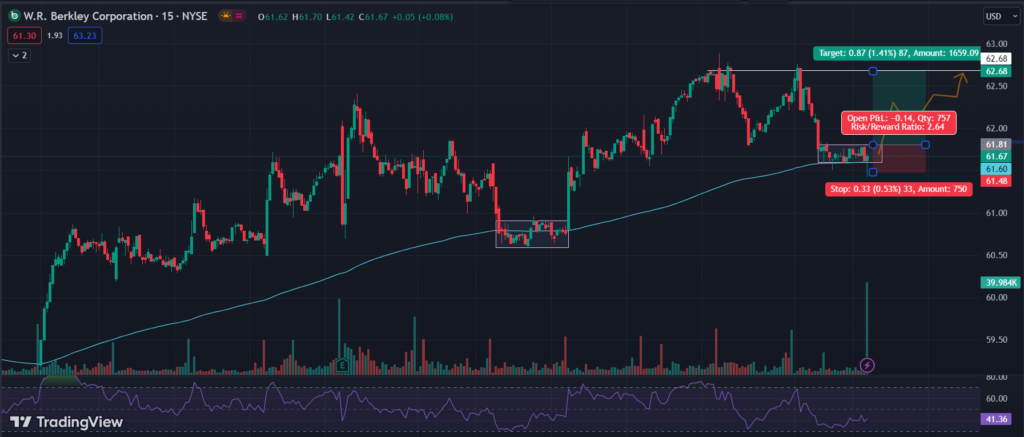
Trade SL and Target –
Entry = Above 61.81
Stop Loss = 61.48
Target = 62.68
Please note: This stock is trading in range bound and you have to wait for breakout / breakdown if it breaks down then ignore this trade because there are many support levels in downside.
To get regular updates on stocks, please join our Discord community.
Our Articles on Long-Term Stock Analysis
My best read on trading is this Book