Bearish Trade: Textron Inc. (TXT) – 89.39
Best Stocks Bearish
Trade Details:
- Taking Resistance at the upper trendline, it may fall again as per past price action records.
- It may fall towards its moving average line as our final target but due to positive market sentiment we have keep our targets small.
- If the market sentiment will also turned into negative then we can plan to hold this trade for few more days.
- It can fall down towards its moving average support levels.
- RSI may reverse from the top as it is trading at the overbought zone and will become negative soon.
- The stock is trading in a channel and reversing from the upper channel to lower support.
- Risk Reward 1:3
Trade, SL, and Target –

Entry = 89.36
Stop Loss = 90
Target = 87.44
Please note: If it opens gap up and crosses above the trendline then ignore this trade. Enter only after a bearish confirmation and triggers our entry price. Hold this trade for few days to get bigger targets.
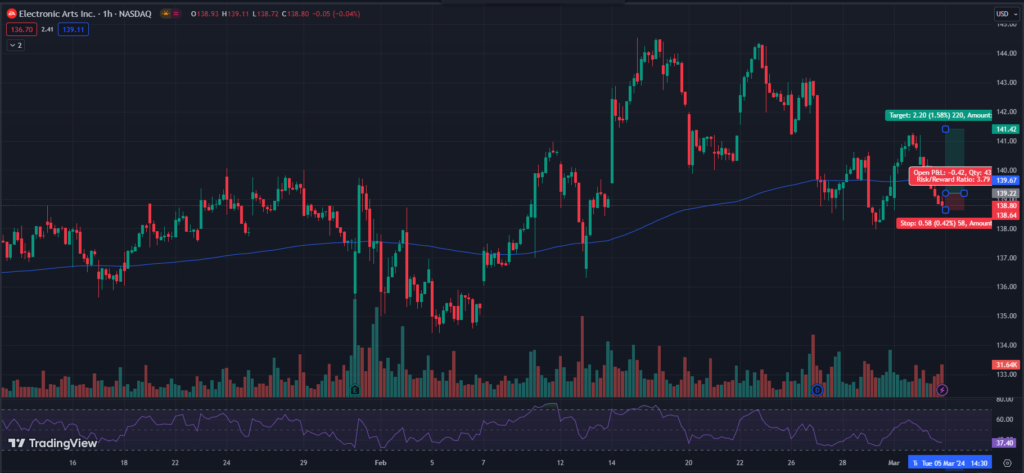
Bullish Trade: Electronic Arts Inc. (EA) – 138.81
Trade Details:
- This stock is consolidating in a zone and trying to take support at the lower levels.
- This trading pattern may lead to a big breakout towards the higher levels. But only if market sentiments support this trend.
- Its volume are also increasing continuously which indicates the buyers interest at current price levels.
- After crossing its EMA levels, it may shoot up with high speed towards 141 & 143 levels.
- If it opens the gap down or below the last swing or below then ignore this trade because after that it may fall sharply.
- RSI is trading flat and it may try to give a good bounce soon.
- Trail your stop loss to the entry price after getting a 1:1 risk reward.
- Risk Reward = 1:3.5+

Trade SL and Target –
Entry = 139.22
Stop Loss = 138.64
Target = 141.42
Please note: Be active with your trailing SL. This trade may reverse from the upper white trendline. If it breakouts then must hold for bigger targets of around 144.
Sell Trade: Eaton Corporation plc (ETN) – 296.58
- This stock is now trading at the top resistance level, it may fall down again towards its lower support levels.
- On the daily chart there is a good bearish candle which indicates the upcoming selloff.
- It is trading too far from its moving average and may show a pullback towards that levels near 292 which is our first half target.
- You can hold this trade for the bigger target of 287 & 285 levels if the overall market sentiment will also become negative.
- RSI is reversing from the higher levels of overbought zone and heading towards the lower zone.
- Strictly follow the Stoploss and Target and trail your stop loss around cost after getting a 1:1 risk-reward on your trade.
- Risk Reward = 1:3.5

Trade SL and Target –
Entry = 295.92
Stop Loss = 298.39
Target = 287.25
Please note: Wait for the breakdown confirmation then enter otherwise it may reverse upwards and breaksout the trendline.
To get regular updates on stocks, please join our Discord community.
Our Articles on Long-Term Stock Analysis
My best read on trading is this Book

