Best Value
Please note this is only an opinion and not financial advice. Direct stock investing is subject to business and market risks. Therefore, it’s highly recommended to do proper risk management and your own due diligence before investing.
Value Stock Analysis As of 11 November 2023
NYSE: NWL – Newell Brands Inc.
- Newell Brands Inc. is involved in the global design, manufacturing, sourcing, and distribution of consumer and commercial products.
- Newell Brands Inc. was founded in 1903 and is based in Atlanta, Georgia.
- The Commercial Solutions segment of Newell Brands offers cleaning, organization, hygiene, and security products globally under brands like Mapa, Quickie, Rubbermaid, and Spontex.
- Newell Brands’ Home Solutions segment offers a range of products, including food storage, cookware, and home fragrance items, under brands like Ball, Calphalon, FoodSaver, Rubbermaid, and Yankee Candle.
- Newell Brands serves a diverse range of retail channels, including warehouse clubs, department stores, mass merchants, e-commerce retailers, and specialty outlets.
- The company also caters to professional customers through commercial product distributors, office superstores, and direct online sales.
- Top Shareholdings of Newell Brands Inc. (NWL):
| Holder | Shares | Date Reported | % Out | Value |
|---|---|---|---|---|
| Pzena Investment Management Llc | 54,796,231 | Sep 29, 2023 | 12.96% | 374,806,228 |
| Vanguard Group Inc | 44,080,728 | Jun 29, 2023 | 10.43% | 301,512,186 |
| Blackrock Inc. | 43,018,373 | Jun 29, 2023 | 10.17% | 294,245,677 |
| Icahn Carl C | 29,985,763 | Jun 29, 2023 | 7.09% | 205,102,623 |
| State Street Corporation | 23,828,527 | Jun 29, 2023 | 5.64% | 162,987,128 |
| JP Morgan Chase & Company | 18,976,904 | Jun 29, 2023 | 4.49% | 129,802,026 |
| Invesco Ltd. | 14,687,558 | Jun 29, 2023 | 3.47% | 100,462,898 |
| Massachusetts Financial Services Co. | 13,086,983 | Sep 29, 2023 | 3.10% | 89,514,965 |
| Nuveen Asset Management, LLC | 11,259,689 | Jun 29, 2023 | 2.66% | 77,016,274 |
| Deprince, Race & Zollo, Inc. | 10,400,074 | Jun 29, 2023 | 2.46% | 71,136,507 |
What we think are PROs of Newell Brands Inc. (NWL):
- The company has consistently increased its annual sales by an average of 3.2% since 2018.
- Current actions of the new CEO are very promising. He is taking assertive steps to improve the company’s situation, implementing effective cost-cutting measures to bring about positive changes.
- The company anticipates generating operating cash flow between $700 million and $900 million and it is expected to produce free cash flow ranging from $400 million to $600 million in 2023.
- Factors like consumer confidence, inflation rate, and the execution of the new strategic initiatives, along with the foreseen savings will play a crucial role in determining the company’s future performance.
- The company’s margins are expected to benefit from price increases, cost-saving initiatives, and easier comparisons.
What we think the RISKs are in Newell Brands Inc. (NWL):
- The company is facing challenges such as inflationary and supply chain pressures, labor shortages, and weak consumer sentiment.
- The company’s financials are not impressive, with high levels of debt and low profitability, indicating a need for a turnaround.
- Newell Brands’ sales growth is expected to be under pressure due to tightening consumer discretionary spending and normalization of demand in the mid-term.
- The company’s top-line growth outlook is not good due to lower demand for discretionary products in an inflationary environment.
FUNDAMENTALS:
Dividend (Yield) = 0.28 (4.17%)
Market Cap. = 2.83B
P/E Ratio = -5.08
52-week Range = 6.50 – 16.76
Revenue = 8.34B
EPS = -1.33
- Technicals:
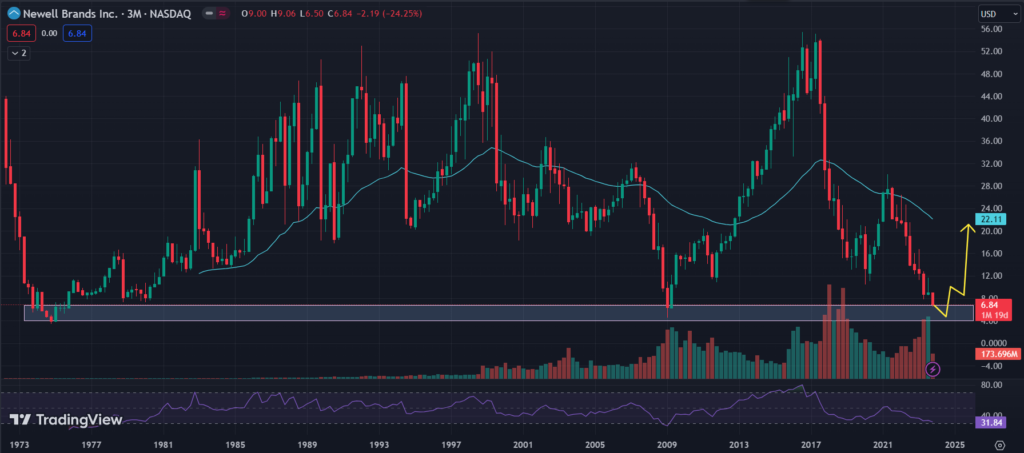
– This stock is trading at its 15-year’s low on the monthly charts as shown in the below chart image.
– Taking support at the very strong support zone of the last five decades.
– Too away from its 200 days Exponential Moving Average. So, it must reverse to the higher levels and touch its EMA.
– Monthly RSI is at an oversold zone around 30 levels and it must be recovered to higher levels after a small consolidation.
– Bouncing from Lower support, it may first bounce up to 22 into one flow as per the past technical patterns.
– You can see the rally in the years 1975, and 2009, and now it seems like making the same pattern and being ready for a new uptrend.
– Increasing in volume from last few months at it is trading at strong support levels.

Entry: 6.50
Target: 22 / 45 / 60
Stoploss: 3.85
Our Final Thought: For people who like to get good deals when investing, this situation is really interesting. Imagine being able to purchase shares of a company when the price is relatively low compared to how much the company is actually worth. It’s like buying something on sale – A great opportunity. This stock’s technical is very strong on the longterm time-frame chart.
I belive that if any company is going to perform good in the future then first its technical will change first and then the good numbers will be seen on news and company’s balance sheet. You can also compare with any of your known good or bad company’s performance in the past. Newell’s revenue is higher than its market capitalization which shows its attractive valuation. Risk-Reward in this company is very good to go and I suggest you to don’t put your big chunk of capital only in this stock, this might be risky for your overall ROI. Keep your portfolio diversified to minimize the risk.
Please note this is only an opinion and not financial advice. Direct stock investing is subject to business and market risks. Therefore, it’s highly recommended to do proper risk management and your own due diligence before investing.
To get regular updates on stocks, please join our Discord community.
Previous Article on Long-Term Stock Analysis

