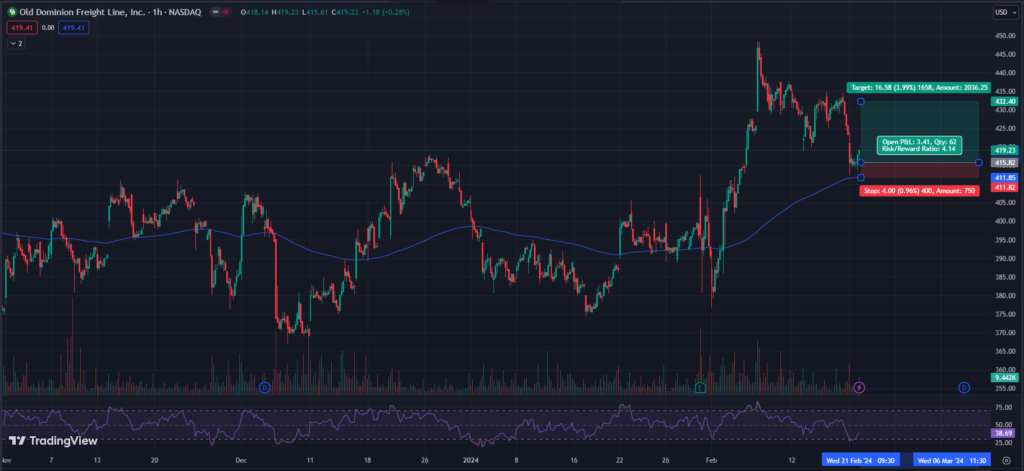
Long Trade: Old Dominion Freight Line, Inc. (ODFL) – 419.41
Best Trading
Trade Details:
- This stock taking support at its moving average line so we can expect a bullish momentum from current levels.
- Trading at the last swing levels which will acts as a support levels for now.
- Also giving a breakout after consolidating for dew hours.
- Trade only if it crosses above 420 or available around 415.
- After hitting the moving average line again there will be a formation of double bottom pattern.
- Market sentiment may be negative so we have to keep strict stoploss.
- RSI is in a positive trend and there is a chances of a upside from current levels. Recovering from the oversold zone.
- Risk Reward 1:4+
Trade, SL, and Target –

Entry = 415.85
Stop Loss = 411.82
Target = 432.40
Please note: It may retest its moving average support against so make sure to re-enter again. If it doesn’t rigger our price then enter into this trade above 420 with low position size.
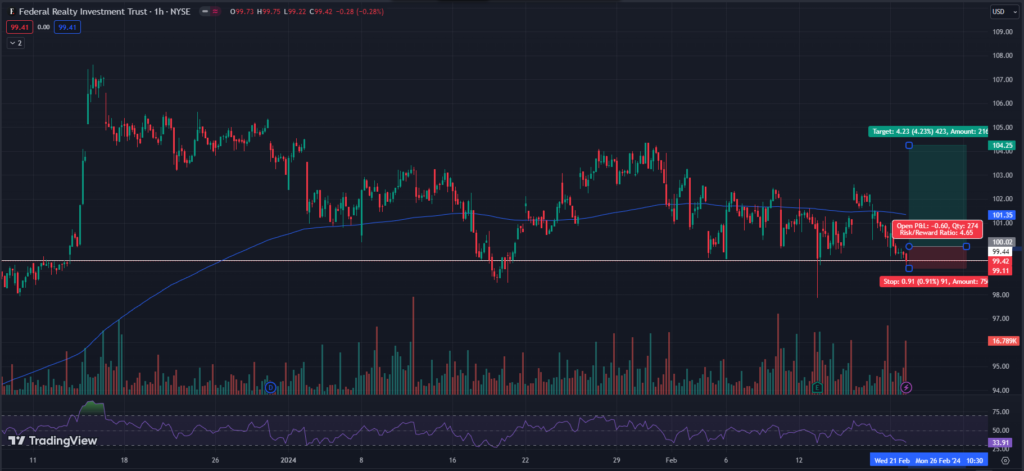
Bullish Trade: Federal Realty Investment Trust (FRT) – 99.41
Trade Details:
- It is taking support at its lower support line around 99-100 levels, which is also a psychological levels.
- Bouncing back from the lower support area after taking a strong support.
- Trading in a channel and now available at lower support channel so we can expect a good bounce from current levels.
- If it opens gap down then don’t enter into this trade.
- You can hold this trade for more than a day if the overall market sentiment is positive and price closed above its EMA levels by the end of the day
- RSI is bouncing from the lower support or oversold zone towards higher levels.
- Trail your stop loss at entry price, if it crosses 101.50
- Risk Reward = 1:4.5+

Trade SL and Target –
Entry = Above 100
Stop Loss = 99.11
Target = 104.25
Please note: Don’t try to make an early entry. If you want to make entry with high confirmation then buy above 100 level. Above 101.50 there will be high confirmation.
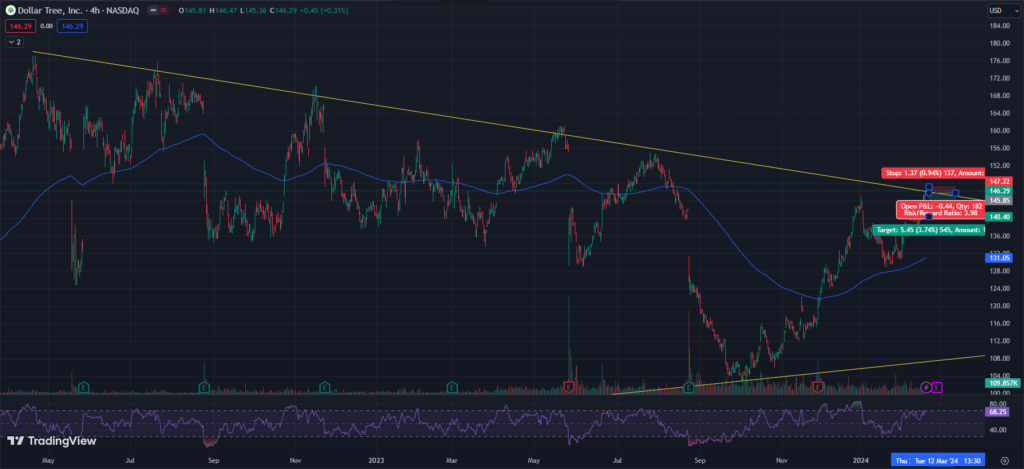
Bearish Trade: Dollar Tree, Inc. (DLTR) – 146.29
- Stock price is respecting its upper resistance levels and try to reverse from that level.
- Yellow trendline is a high resistance area from where stock may reverse downwards.
- Our final target will be its moving average line near 130.
- It is respecting its EMA as a resistance levels so we can expect a sharp fall from current levels.
- It is heading towards its lower support levels of 140 & then 130.
- If it start trading above its yellow trendline then ignore this trade.
- RSI is flat now and trading at upper overbought zone, it may touch it lower zone again.
- Strictly follow the Stoploss and Target and trail your stop loss at cost if the price crosses below 144
- Risk Reward = 1:4

Trade SL and Target –
Entry = 145.85
Stop Loss = 147.22
Target = 140.50
Please note: If it closes in out favor then we can keep this trade for next 2-3 days for bigger targets near 130 levels.
To get regular updates on stocks, please join our Discord community.
Our Articles on Long-Term Stock Analysis
My best read on trading is this Book

