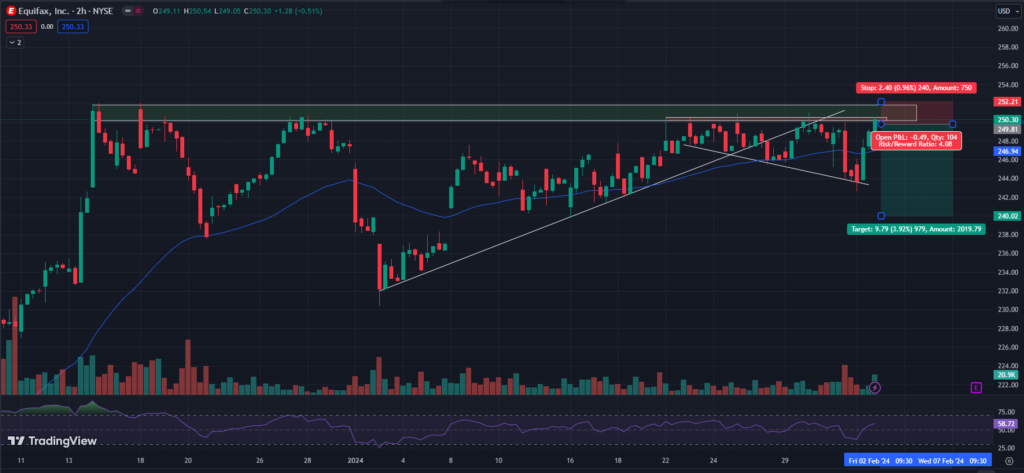
Bearish Trade: Equifax Inc. (EFX) – 250.33
Best Stocks Bearish
Trade Details:
Bearish Trade
- Price is facing resistance at current levels and this levels has retested more than 5 times and acted as a resistance.
- Price is consolidating at the upper resistance levels so it can give a breakout also then we can go long as well after breakout.
- There is also a trendline support so ensure that you can trail your stoploss after crossing below its moving average.
- The last upper swing will act as the stop loss and resistance. But trade only below 250 and in downward direction which is also acts as a psychological levels.
- RSI is turning into positive, which indicates the bullish sign for this stock.
- Keep your SL strict and trail accordingly.
- Risk Reward 1:4+
Trade, SL, and Target –

Entry = 249.81
Stop Loss = 252.21
Target = 240
Please note: If this stock opens gap up then wait for the confirmation to short on 15 minutes chart. But if it gives a breakout above the zone then you can also plan to go long if market sentiments supports this.
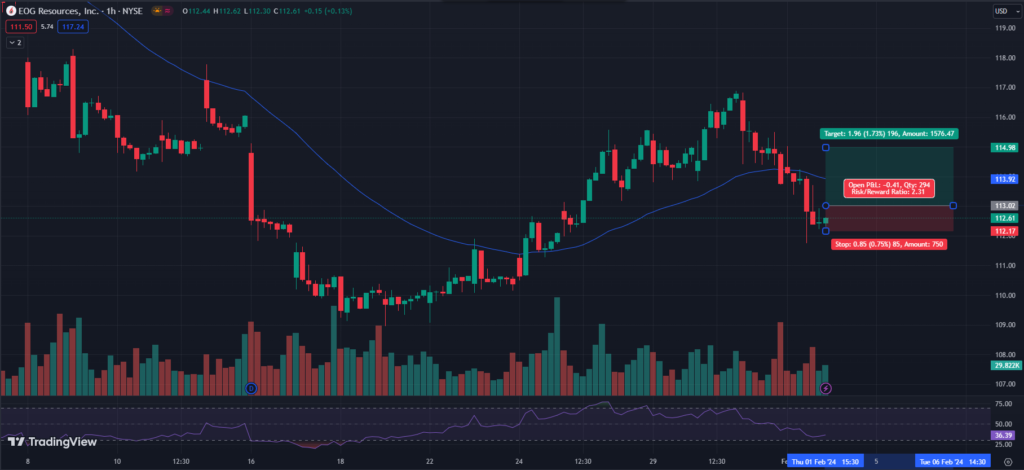
Bullish Trade: EOG Resources, Inc. (EOG) – 112.60
Trade Details:
- This stock is trying to continue its uptrend after a small pullback. So we are expecting a move towards 115 & 118
- This is trading below its moving average and after a little consolidation it will bounce again.
- There is moving average at 113.92, if you want to trade with high confirmation then enter only above its moving average.
- The last three candles are little confusing so I suggest you to enter only after a strong bullish confirmation candle.
- RSI is in the bearish trend and it is trading flat for now but may give a big bounce towards the 50 levels and above.
- Trail your stop loss to the entry price after getting a 1:1 risk reward.
- Risk Reward = 1:2.3

Trade SL and Target –
Entry = Above 113
Stop Loss = 112.17
Target = 115
Please note: Enter only after our entry levels triggered otherwise it may fall further. Keep your SL strict. You can hold this trade for more few days if it closes in profit today.
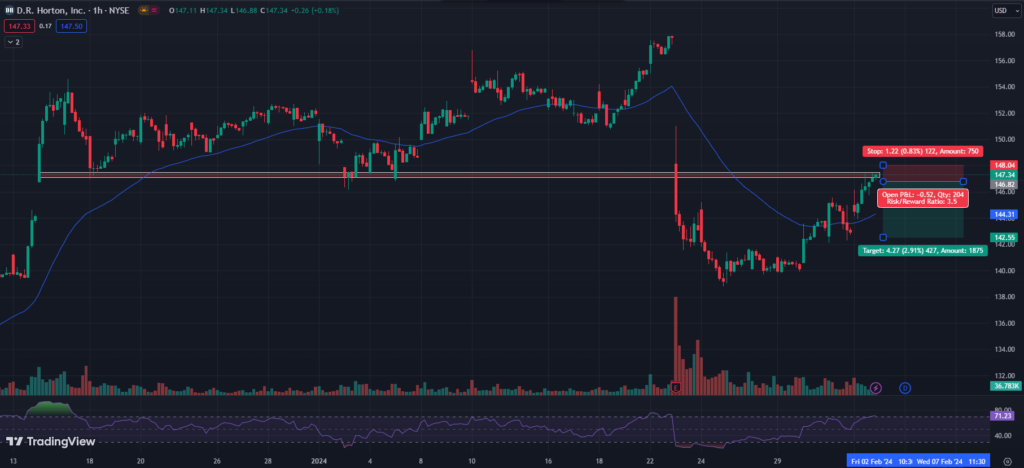
Short Trade: D.R. Horton, Inc. (DHI) – 147.33
- Last trading day it showed a upside and now we are planning for a reversal because it has reached at very strong resistance levels.
- There is a very bullish candle called hammer candle and it will in a a strong uptrend.
- This chart looks like it is in a bearish trend and fall further near 140.
- Trade only if this stock opens flat and gives downside momentum otherwise it may start moving upward above the resistance zone.
- RSI is trading near overbought zone it will give a breakdown and fall towards near 30-40
- Strictly follow the Stoploss and Target and trail your stop loss around cost after getting a 1:1 risk-reward on your trade.
- Risk Reward = 1:3.5

Trade SL and Target –
Entry = 146.82
Stop Loss = 148.04
Target = 142.55
Please note: Keep trailing your stoploss. If it move in our favor today then we can hold this trade for few more days for bigger profits.
To get regular updates on stocks, please join our Discord community.
Our Articles on Long-Term Stock Analysis
My best read on trading is this Book

