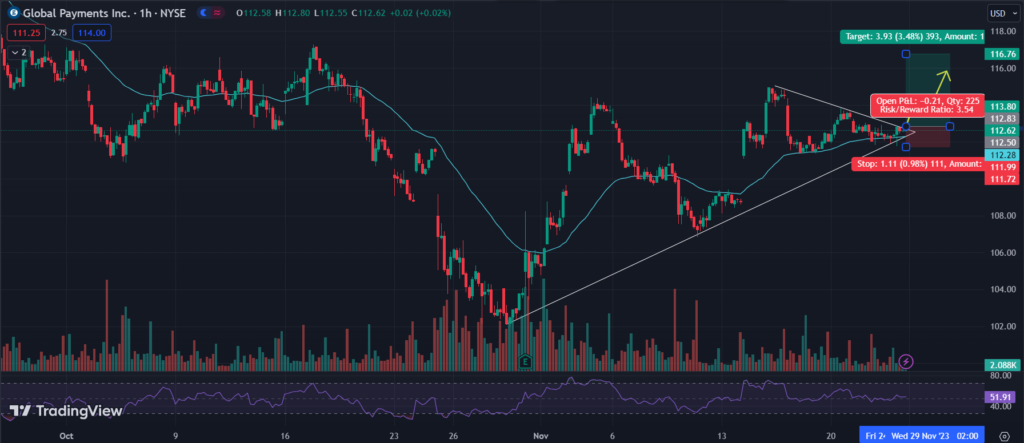
Bullish Trade: Global Payments Inc. (GPN) – 112.63
Best Bullish
Trade Details:
- There is a formation of symmetrical triangle pattern and after a breakout it will shoot up like a rocket.
- Wait to cross our entry price or for a breakout to enter into this trade.
- It is also reversing from a EMA support and may bounce back again to higher levels.
- Trading range is becoming narrow day by day which increases the posabillity of a big breakout.
- RSI is trading flat and is stuck in a mid range. it will also give a breakout towards 70 -75 levels.
- Trail your stop loss at entry price after getting a 1:1 risk reward.
- Risk Reward 1:3.5+
- When you are entering into this trade look at the overall market trend. If the market trend is negative then you can also plan to sell this trade.
Trade, SL, and Target –

Entry = 112.83
Stop Loss = 111.99
Target = 116.75
Please note: You can trade this stock both side up or down while watching the overall market sentiment and the stock breakout momentum. Higher Probability on Upside breakout.
Sell Trade: Moody’s Corporation (MCO) – 362.38
Trade Details:
- This stock has been facing selling pressure from the Top level.
- There last day shooting star candle indicates high bearishness in this stock.
- Stock Price has stretched too much, so we are planning for a bearish reversal with a negative price action.
- RSI was very bullish and gone into overbought zone and now it will fall down to lower levels which impact the price negatively.
- Trail your stop loss to the entry price after getting a 1:1 risk reward or below 356.
- Risk Reward = 1:2.5+

Trade SL and Target –
Entry = 359.88
Stop Loss = 363.36
Target = 350.20
Please note: Stock is in bullish trend but top red candle is very bearish and will shows negative impact on stock price. Enter only after stock price trigger our entry price.
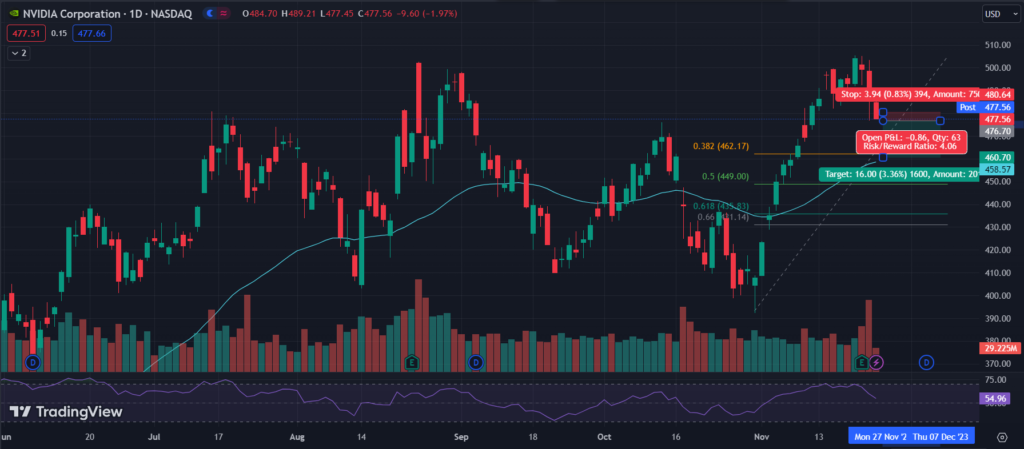
Momentum Trade: NVIDIA Corporation (NVDA) – 477.56
- This stock is now trading in a channel and currently it is at the upper channel of the zone.
- Now, it is reversing towards lower channel from top resistance zone of 500.
- Reversing from its upper resistance zone of trendline as of the last time around august end month.
- Our target is around Fibonacci first support after drawing from top to bottom price levels.
- But there is also a support zone around 475 – 473. so keep SL trailed below that price because it may reverse.
- RSI is falling sharply from higher levels to the bottom.
- Strictly follow the Stoploss and Target and trail your stop loss around cost after getting a 1:1 risk reward on your trade.
- Risk Reward = 1:4

Trade SL and Target –
Entry = 476.70
Stop Loss = 480.64
Target = 460.70
Please note: Enter into trade only price breaks down the last two days trading low and starts trading below 476.90
To get regular updates on stocks, please join our Discord community.
Our Articles on Long-Term Stock Analysis
My best read on trading is this Book

