

BUY Trade: Public Storage (PSA) – 274.16
Best Trading
Trade Details:
- This stock is giving a pullback and now preparing for the bounce towards higher levels.
- If the stock opens a Gap down then it may fall again to the lower channel. So ignore it in case of a gap-down opening.
- It may try to hit its upper resistance near 282 because it is trading in a parallel channel.
- There is its moving average which will also acts as a support levels.
- After crossing above 277.50 you can trail your stoploss at your entry price.
- RSI is bearish and currently trading near the bottom. It must be bounce to higher levels soon.
- Trail your stop loss at entry price after getting a 1:1 risk reward.
- Risk Reward 1:4
Trade, SL, and Target –
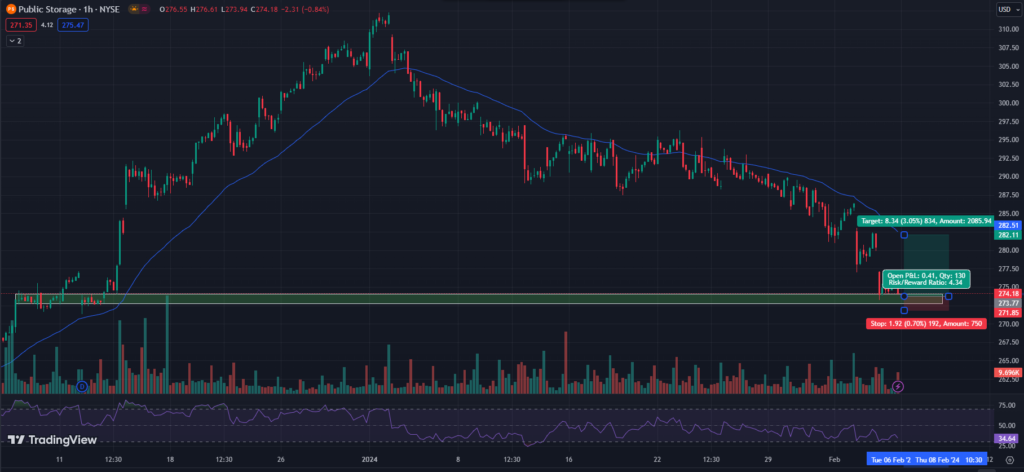
Entry = 273.55
Stop Loss = 271.85
Target = 282
Please note: If it opens gap up then wait for enter. Only enter if it crosses downwards to upwards and triggers 273.77
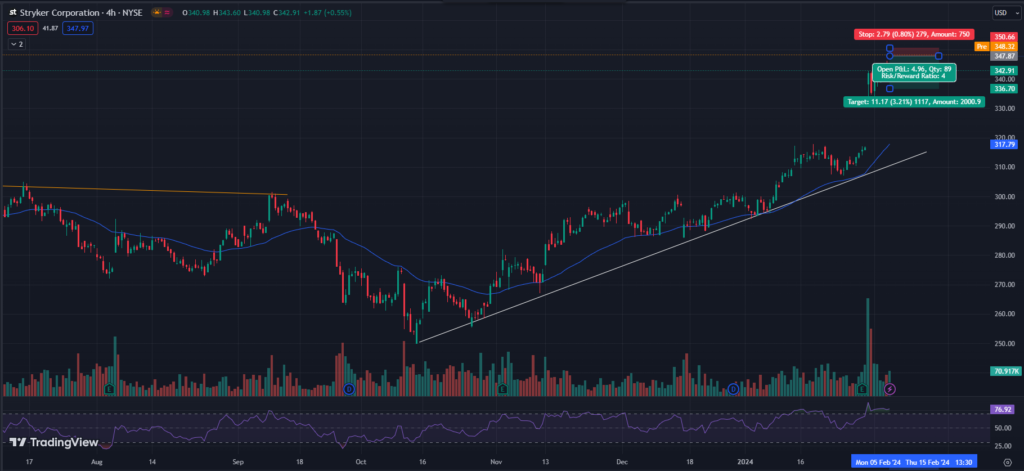
Sell Trade: Stryker Corporation (SYK) – 348.32
Trade Details:
- It is taking resistance at the top near 350 levels and it may fall back from the current levels oy try to fill out the gap.
- There is also a psychological levels of 350 which will acts as a supply zone.
- EMA is acting as a support levels and price is also looking bearish at top levels near 350.
- You can keep your stop loss strict because if it breaks 350 then it may increase quickly.
- RSI is trading at overbought zone so it may try to cool down and slips towards 320.
Trade SL and Target –
Entry = 347.87
Stop Loss = 350.66
Target = 336.70
Please note: This stock will open gap up and we will plan to short near 350. Short when it start crossing 348 downwards.
Long Trade: Omnicom Group Inc. (OMC) – 88.80
- Expecting a bounce from lower support zone which indicates the strong bullish sign in this stock.
- This trendline breakdown might be a trap for sellers and then it will move towards higher levels again.
- It is trading below its moving average support now. If you want to trade with high confirmation then enter only above its moving average.
- Price is also taking support at the previous support around 88 levels.
- Our target will be the upper resistance zone of 91.
- Trade only above the entry point otherwise it may fall to the lower levels.
- RSI is trading at 39 levels and it may go upto 70-75 levels.
- Strictly follow the Stoploss and Target and trail your stop loss around cost after getting a 1:1 risk reward on your trade.
- Risk Reward = 1:3

Trade SL and Target –
Entry = Above 89
Stop Loss = 88.10
Target = 91.79
Please note: If it breaks the lower support zone then must exit at SL. You can try to re-enter when it reverses upward.
To get regular updates on stocks, please join our Discord community.
Our Articles on Long-Term Stock Analysis
My best read on trading is this Book