BUY Trade: The Boeing Company (BA) – 208.58
Best Trading
Trade Details:
- This stock has formed a consolidation zone and it seems like will give a breakout above the upper trendline.
- There is a symmetrical triangle pattern, we can expect a big move after breakout.
- This will give a breakout or breakdown. Our high conviction is on Upside.
- If the market opens a Gap down then wait for the trendline breakout it may bounce again to the higher levels or towards our target price.
- Ignore this trade if this stock doesn’t breakout. we don’t enter on selling side.
- RSI is becoming bullish after trading in a flat range. It may shoot up to 80 levels.
- Trail your stop loss at entry price after getting a 1:1 risk reward.
- Risk Reward 1:6
Trade, SL, and Target –

Entry = Above 209
Stop Loss = 207.30
Target = 219.75
Please note: If you want to trade with high confirmation then enter into this trade only if it gives a breakout of the triangle pattern above white trendline.
Bullish Trade: The Goldman Sachs Group, Inc. (GS) – 385.75
Trade Details:
- This stock’s will try to give a breakout above the upper trendline.
- There was a trendline earlier from the current levels and after respecting its trendline as the support now it is ready for a breakout above the last resistance levels.
- It has a perfect price action and triangle pattern for the next breakout.
- You can keep your stop loss strict, if you are able to take high risks then keep your SL below the last lower swing.
- RSI is in very bullish trend and trading above 50, it will continue with the over all market trend.
- If it gives a breakdown then ignore this trade because it may be trap for sellers and again it will become positive.
- Risk Reward = 1:3

Trade SL and Target –
Entry = 385.75
Stop Loss = 382.67
Target = 395
Please note: Ignore this trade if it starts trading below the white trendline and enter only when it triggers our entry price.
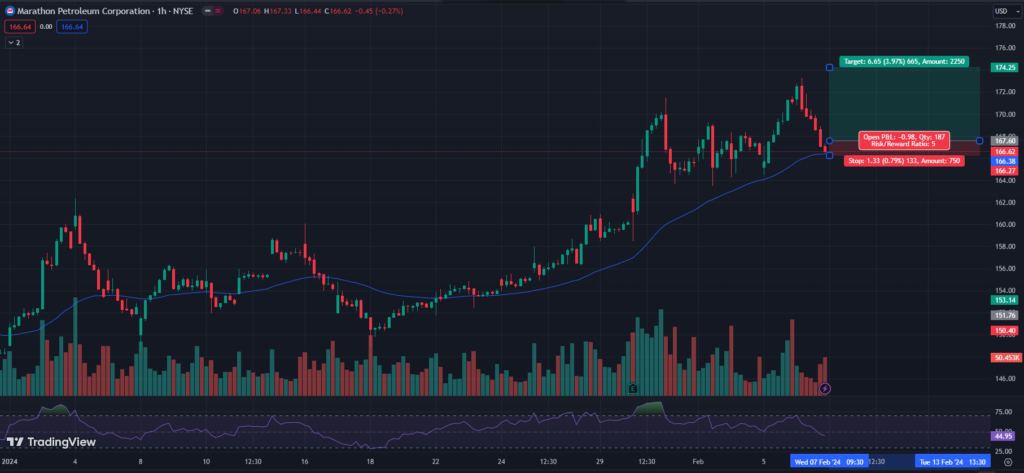
Long Trade: Marathon Petroleum Corporation (MPC)– 166.62
- This stock is trying to give a reversal from the lower Moving Average support levels.
- Enter only if reversing from its EMA support levels with very good bullish candles.
- Over all Oil sectors has good news and starting a new bullish trend.
- Trade only above the entry point otherwise it may reverse to the lower levels and continue in the same range.
- RSI is trading flat in a bullish zone and it may go up again up to 75 levels.
- Strictly follow the Stoploss and Target and trail your stop loss around cost after getting 1:1 risk reward on your trade.
- Risk Reward = 1:5

Trade SL and Target –
Entry = 167.60
Stop Loss = 166.25
Target = 174.25
Please note: Trading at lower MA support, enter only if it bounces otherwise it may slips further.
To get regular updates on stocks, please join our Discord community.
Our Articles on Long-Term Stock Analysis
My best read on trading is this Book

