BUY Trade: M&T Bank Corporation (MTB) – 116.86
Best Trading
Trade Details:
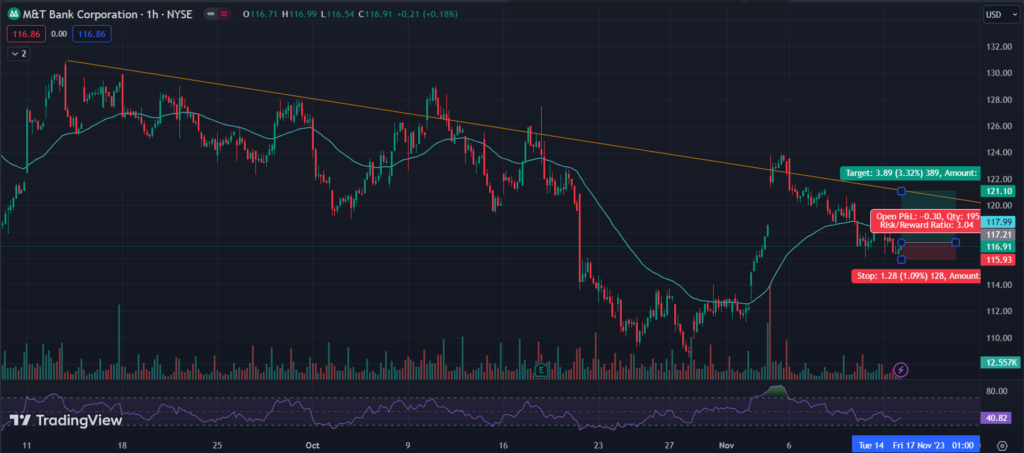
- This stock is consolidating and its RSI is sliding down which indicates the new upcoming bullish momentum.
- If the market opens a Gap down then it may fall again to the lower channel. So ignore it in case of a gap-down opening.
- It may try to hit its upper trendline resistance again.
- After crossing above its EMA you can trail your stoploss at your entry price.
- RSI is negative and currently trading at 40. It must be reversed to higher levels.
- Trail your stop loss at entry price after getting a 1:1 risk reward.
- Risk Reward 1:3
Trade, SL, and Target –

Entry = 117.21
Stop Loss = 115.93
Target = 121.10
Please note: This stock is in a downtrend so enter into a trade with very strict stoploss. If it goes in favor than you can hold this trade for bigger targets.
Sell Trade: Norfolk Southern Corporation (NSC) – 199.07
Trade Details:
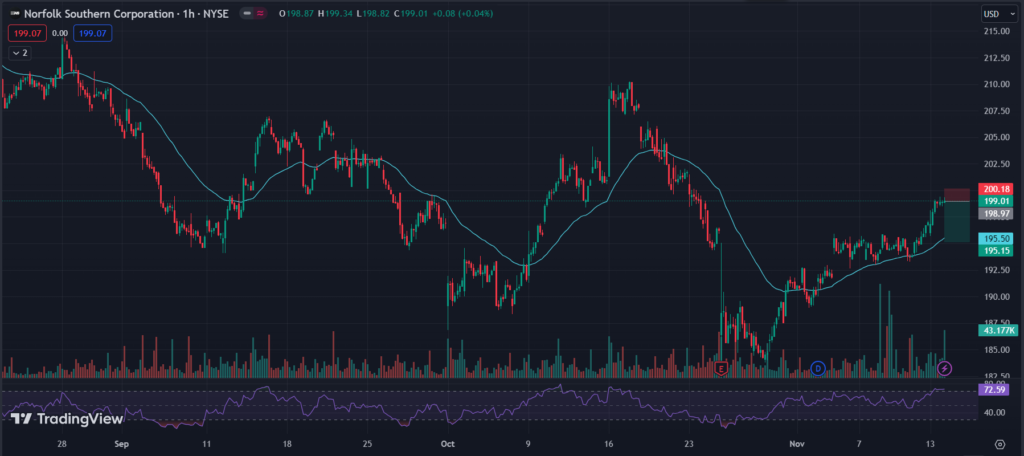
- This is trading too far from its EMA so it may fall down to its moving average support.
- There is also a strong resistance
- Falling below its 200 EMA makes it weaker on the hourly charts. so, you can also hold this trade with trailing stoploss.
- You can keep your stop loss strict because it is currently in an uptrend and we are planning for reversal.
- RSI is in the overbought zone and it will go down slowly.
- Risk Reward = 1:3+

Trade SL and Target –
Entry = 198.97
Stop Loss = 200.18
Target = 195.15
Please note: Ignore this stock if it opens a very big gap up. trade only in downward trend.
Long Trade: AT&T Inc. (T) – 15.58
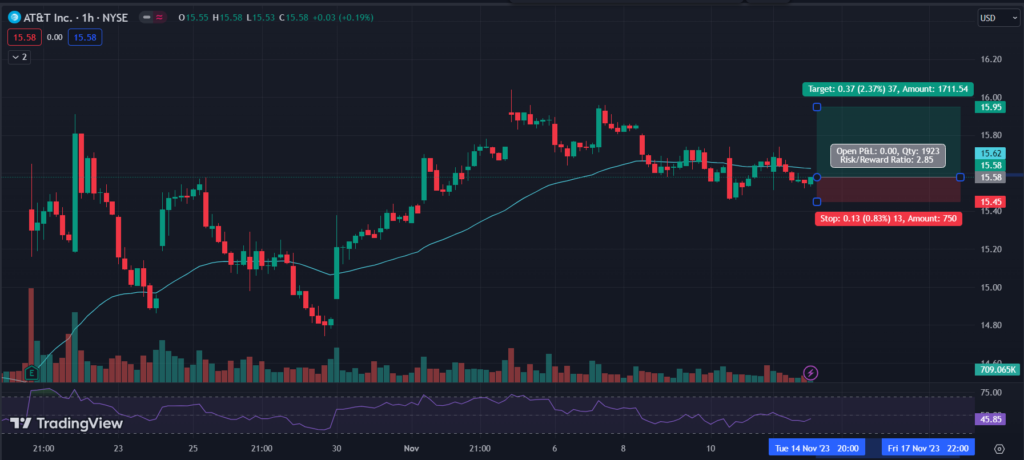
- Trendline breakout and it may shoot up after a small pullback as seen on the below charts.
- It is going to cross it EMA levels which will act as a resistance level and a trendline breakout.
- Price also takes support at the previous support levels of 15.50 levels.
- Trade only above the entry point otherwise it may reverse to the lower levels.
- RSI is trading at 45 levels and it may go upto 70-75 levels.
- Strictly follow the Stoploss and Target and trail your stop loss around cost after getting a 1:1 risk reward on your trade.
- Risk Reward = 1:2.5+

Trade SL and Target –
Entry = 15.58
Stop Loss = 15.45
Target = 15.95
Please note: If you want to trade with more conformity then enter into a trade above its moving average line which is also a trendline breakout.
To get regular updates on stocks, please join our Discord community.
Our Articles on Long-Term Stock Analysis
My best read on trading is this Book

