Short Trade: W.W. Grainger, Inc. (GWW) – 801.45
Best Trading
Trade Details:
- The Daily charts show there is a resistance level of around 807.
- Trading too far from its moving average and it may try to retest its EMA levels.
- Around 780 there is s support, so it may slip towards its last lower swing.
- After breaking 775 levels it may fall deeper so you can hold this trade while trailing your stoploss.
- RSI is trading in the overbought zone and it may try to reverse.
- You can hold this trade for a few days for a better move if it closes in favor.
- Risk Reward 1:3
Trade, SL, and Target –

Entry = 799.29
Stop Loss = 807.25
Target = 775.50
Please note: Ignore in case of Gap-up opening and hold this trade if it goes in or favor with trailing SL till 750 levels.
Sell Trade: TE Connectivity Ltd. (TEL) – 130.55
Trade Details:
- Stock is trading at the upper resistance levels and it may reverse to lower level again.
- Trading too high from its Exponential moving average.
- Waiting for a breakdown of support and may try to touch lower levels.
- Do not trade if this crosses above 131.50 levels.
- RSI is trading in an overbought zone and it may reverse towards its lower levels.
- Risk Reward = 1:3

Trade SL and Target –
Entry = 130.42
Stop Loss = 131.40
Target = 127.50
Please note: If this stock opens Gap down and starts moving upwards then ignore this trade, enter only if it trigger our entry in downtrend direction.
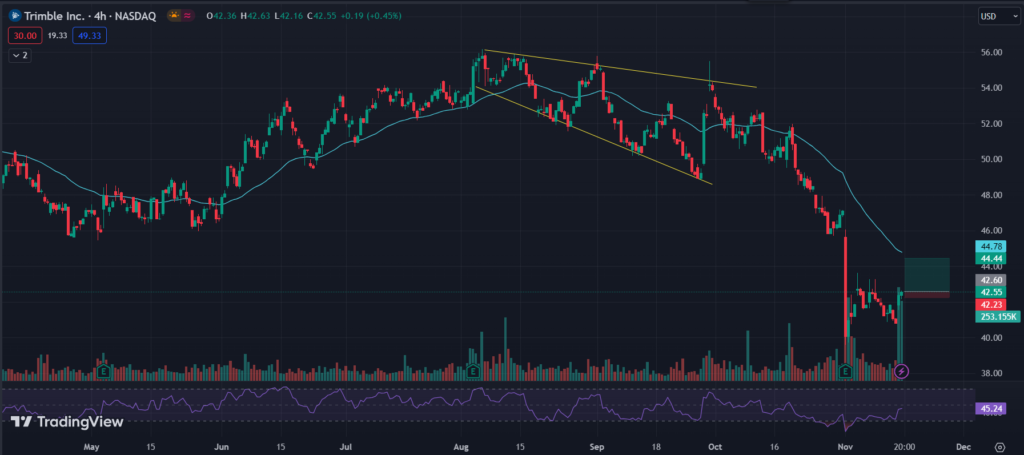
Long Trade: Trimble Inc. (TRMB) – 42.54
- Strong support zone at the current level around 40 on daily charts.
- It may try to retest its 200 EMA resistance zone as its first target.
- The formation of a double bottom at the lower levels indicates the trend reversal of this stock.
- Its EMA and last swing resistance are at the same level as our target levels.
- Trade only when there is a breakout above 42.50 because it may reverse again below that price level.
- RSI is becoming bullish and reversing from the oversold zone towards higher levels.
- Strictly follow the Stoploss and Target and trail your stop loss at cost if the price goes above 43.50
- Risk Reward = 1:5

Trade SL and Target –
Entry = 42.60
Stop Loss = 42.23
Target = 44.45
Please note: This stock has made a double-bottom pattern so there will be more breakout probability above 42.60 levels.
To get regular updates on stocks, please join our Discord community.
Our Articles on Long-Term Stock Analysis
My best read on trading is this Book

