Bullish Trade: Dominion Energy, Inc. (D) – 45.86
Stock Bullish
Trade Details:
- There is a trendline breakout and it is giving a pullback and preparing for the bounce.
- Currently it is in a consolidation zone and will give a breakout soon.
- Closes the daily candle above its EMA which is also a bullish sign and it is ready for uptrend from this levels.
- It can go towards higher levels so hold this trade if it close today’s candle in our favor.
- The upper resistance level will be our first target near 47 levels.
- RSI is trading in bullish zone and it will hit near 75-80 levels.
- Risk Reward 1:2.5+
Trade, SL, and Target –

Entry = 45.90
Stop Loss = 45.49
Target = 47
Please note: This is a high probability trade so make sure you re-enter if it doesn’t work out in first try. But Strict with SL.
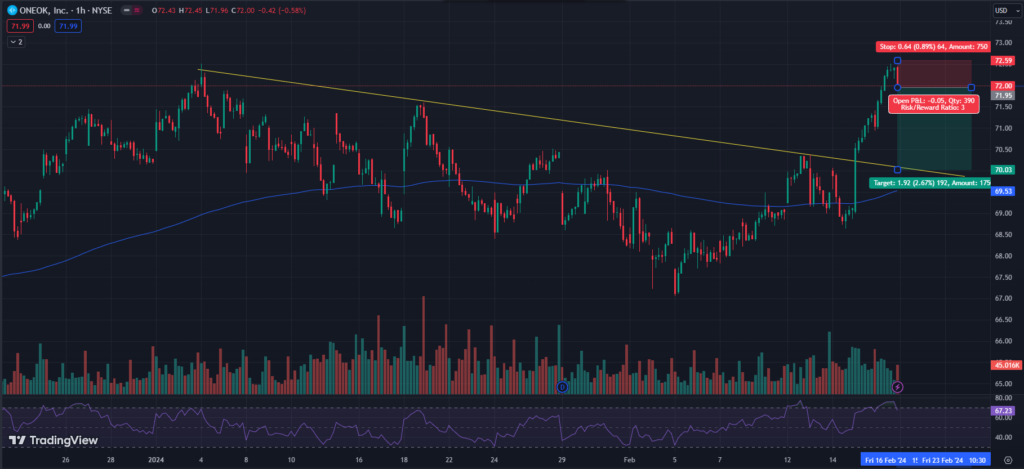
Sell Trade: ONEOK, Inc. (OKE) – 71.99
Trade Details:
- This stock is trading at its upper resistance levels and trying to reverse from higher levels.
- Stock has already moved up and now coming down back to the support levels.
- If it goes above 72.75 then it will create a higher high pattern which is against our favor and gives a breakout. So exit then.
- Trade only if it triggers our entry price in downward direction.
- RSI is reversing from overbought zone and it must be fall from this to lower levels.
- Risk Reward = 1:3

Trade SL and Target –
Entry = Below 71.95
Stop Loss = 72.59
Target = 70
Please note: Wait for the first few minutes to observe price action and then plan to enter into this trade and must exit from this trade if it crosses above the last higher swing or above 72.75
Long Trade: The Charles Schwab Corporation (SCHW) – 64.10
- It is bouncing from the previous support zone of 60. It may bounce again to higher levels above 65.
- White line is a resistance levels and it will try to give a breakout above this.
- There is very bullish trend with a small resistance at the 65 levels.
- Moving average is the very strong support and price will bounce from this level.
- Don’t trade if this goes below 63.50 levels otherwise it will burn your position.
- RSI is trading flat near 57 and it may start a new uptrend from here and in a bullish trend.
- Strictly follow the Stoploss and Target.
- Risk Reward = 1:3+

Trade SL and Target –
Entry = Above 64.43
Stop Loss = 63.82
Target = 66.34
Please note: You can hold this trade for bigger targets for few days but keep trailing your stoploss.
To get regular updates on stocks, please join our Discord community.
Our Articles on Long-Term Stock Analysis
My best read on trading is this Book

