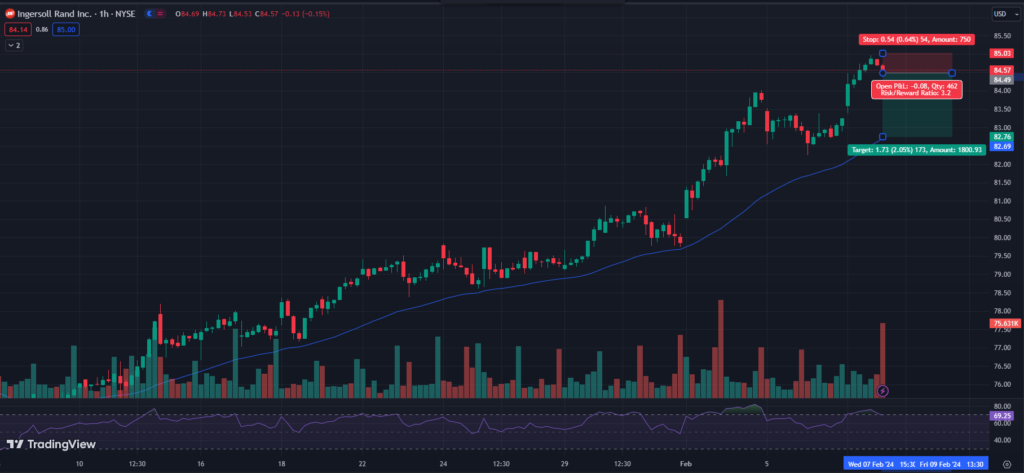
Short Trade: Ingersoll Rand Inc. (IR)– 85.04
Top Stocks Bearish
Trade Details:
- Resisting the upper trendline. It seems to be in bearish mode and fall sharply from current levels.
- It is now stretched too much and it may fall down to retest its moving average lines.
- On the daily charts stock is oversold and it will correct sharply from these levels.
- If your Risk appetite allows you then you can increase your SL to 87 and hold this trade for bigger targets towards 80 levels.
- You can also wait for confirmation of the breakdown to enter into trade, that may be a double to or inverted hammer pattern.
- RSI is trading in the overbought zone and it will reverse towards lower levels.
- Risk Reward 1:3+
Trade, SL, and Target –

Entry = Below 84.50
Stop Loss = Above 85
Target = 82.75
Please note: This stock may open gap up and become high volatile so must enter only after it crosses down below 84.50
Long Trade: NetApp, Inc. (NTAP) – 87.23
Trade Details:
- Stock is trading at the strong support of the lower trendline, it will bounce very quickly.
- There is a Ascending triangle pattern which increases the chances of breakout at this time.
- Stock is making a narrow range which indicates the upcoming breakout.
- It may fall also but along with the positive market sentiment we can plan for the bullish trend.
- As soon as it crosses its moving average then you can make an entry in this stock.
- You can hold this trade for the bigger target after it closes in our favor or above 88.50
- RSI is trading flat near 34 and it will move towards higher levels.
- Trail your stop loss to the entry price after getting a 1:1 risk reward.
- Risk Reward = 1:2+

Trade SL and Target –
Entry = 87.52
Stop Loss = 86.74
Target = 89.32
Please note: It may make a trap for sellers. So, plan to go long only with the bullish market trend. High conviction on Upside momentum.
Buy Trade: F5, Inc. (FFIV) – 183.29
- This was positive last day at its support levels. It may increase the chances of breakout.
- There is a triangle pattern in this stock which may gives a breakout today.
- If the market sentiment will be positive then we can hold this trade for the next 2-3 days.
- There is also a support at the current levels so price may bounce again to the higher levels.
- RSI is trading flat and consolidating. It will give a good breakout above 50 and try to hit 80 levels.
- Strictly follow the SL & Target and trail your stop loss around cost after getting a 1:1 risk-reward.
- Risk Reward = 1:3

Trade SL and Target –
Entry = 183.74
Stop Loss = 183.29
Target = 188.75
Please note: High probability breakout. Make sure you enter only above its moving average with stoploss.
To get regular updates on stocks, please join our Discord community.
Our Articles on Long-Term Stock Analysis
My best read on trading is this Book

